ADJUSTING TONAL CONTRASTS
The CT scanner
produces 12-bit data (i.e., grayscales can range from 0 to 212-1, or
0 to 4095). The scanner software
can output this data as either 8-bit or 16-bit files. 16-bit files contain the full-resolution scan data, but
can't be used well in programs like Adobe Photoshop, NIH Image, or
VoxBlast. 8-bit files are more
useful for most processing, but involve some loss of data resolution.
Photoshop
allows you to adjust the tonal range (brightness, contrast, color) values in
your image. To ensure that you
have a smooth distribution of grayscale values represented in your image, you
want to adjust the levels while your image is in the highest color/gray
resolution—in other words, do not keep adjusting levels on the same set
of images over and over!
Working
Tips:
• Computer monitors are inconsistent. When you are adjusting the grayscale levels of your images, use the same computer until this task is complete. Otherwise, you might set varying degrees of contrast in your images according to what you have seen on different monitors. Typically, PC monitors tend to be darker than Mac monitors; therefore, it would be wise to test a few images on different computers to ensure the contrast is optimal on both platforms.
•
Create a stack using the 8-bit version of your dataset, look through it and
choose at least 3 images on which to test your level adjustments. Two things to include in your test
images are large grayscale contrasts (i.e. find the images with the brightest
pixels), and thin bones surrounded by air.
•
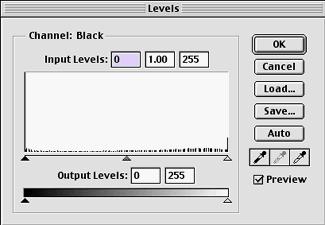
Be sure Preview box is checked in levels dialog box.
•
Check the look of your images on both PC and Mac before finalizing your
adjustments and batch processing them.
Remember that things look darker on PCs! When in doubt, use the histogram as your primary guide.
•
Watch out for tradeoffs between losing outside boundary of thin/spongy bones
surrounded by air while improving visibility of high contrast internal
elements. If you over-increase the black values you will lose your thin bones;
if you over-increase the white values you will max out lighter areas such as
enamel.
•
On the second pass of level adjustments (details below), set the white output
levels to 239, to save some room for label colors.
•
Hold down Option/Alt key and the “cancel” button on the levels
dialog box will change to “reset”.
•
Adjust as few times as possible.
You will be going through 2 adjustment steps for each set of images.
Once you hit “OK” on your second pass and then you want to adjust
more, it is better to start over with an archive image.
•
Write down all input and output values!
You
will do 2 adjustment passes on your images, one before and one after reslicing.
PASS 1
Open
your image and get the adjust levels dialog box: Image Menu> Adjust>
Levels. This will display a histogram of the
lightest (value = 255) to darkest (value = 0) pixels in your image. Input levels can be adjusted by typing
values in the 3 boxes above the histogram or by sliding the black, gray and
white triangles along the x-axis of the histogram. (Be sure the preview box is checked!)
Your 16-bit
images will appear black because the histogram is compressed to the left, so
you must input a new value in the input levels box to spread out the
histogram.
Change values
in the input levels boxes to read : 0, 1.00, 15
Press
OK, then call up the Levels dialog box again to examine the adjusted histogram.
Your histogram
should now look more spread out, and you will see some definition in your
image.
You should set
up an Action to combine this initial leveling with changing your images from
16-bit to 8-bit. Make sure to
level to 15 before
changing mode to 8-bit, again, to work with as much data as possible.
Now is the
time to RESLICE, before you do any further leveling. This way NIH/Scion Image has as much data available to it as
possible.
PASS 2
In the
histogram shown above, the large peak to the left represents the air
surrounding the specimen. The smaller
peak to the right is the specimen; you can see that it has tails to either
side, representing the range of grayscale values in it. If you adjust the slider bars in,
excluding any part of the histogram, you will lose data, because the grayscale
values outside your slider bar will be condensed.
Open several
slices from your original slice axis. Examine your histogram and slide the
white input triangle and the black triangle to the appropriate values: the goal
is to darken the background, and increase the contrast of your images, without
compromising the data too much.
Once you find a set of values that you like for one slice, try them on
the other few slices. Remember,
you want to test on slices that include your brightest pixels (generally, the
enamel of teeth) and thinnest bones (generally, nasal turbinates and auditory
bullae). Once you have found the
best values, WRITE THEM DOWN!
Then, run a batch action in which you adjust to those levels, AND, set
the white output level to 239 (this leaves 16 grayscale values available
for labeling).
Remember that
once you click OK, you should not adjust the image again. Each successive adjustment will result
in further loss of data. For
example, here is what the histogram looks like for an image that has been
leveled three times:
After leveling
your data twice, start over with your resliced images if you change your mind
on the levels you chose for your second pass. Make sure you write down the input levels you used.
It is best to carefully check these adjustment values on other images, check the look of your image on both PC and Mac before finalizing your adjustments and batch processing.